By the numbers
If you haven’t figured it out yet, I love spreadsheets. Spreadsheets hold all sorts of fascinating information, data, statistics, trends, averages, records, really cool stuff. I keep a very detailed spreadsheet on our travels, recording our movements in long columns and rows which add to our photos, blogs and memories that we’ve collected along the way. Here’s a snapshot of some of the data from the second leg of our Follow the Sun journey – our travels in Mexico, Central America and South America.
The Basics
Total days – 146
Total miles – 19,307 (Total kilometres – 31,277)
Average miles per day – 132 (Average kilometres per day – 214)
Total gallons – 1,652 (Total litres – 6,277)
Average miles per gallon – 11.5 (Ave litres per 100 km – 20.3)
So at an average of 132 miles per day this equates to only two or three hours of driving between campsites but that calculation includes many zero days where we didn’t drive anywhere and also some huge driving days. Our longest driving day was a massive 412 miles (667 kilometres) which covered a long stretch of Chile’s great motorway system (and practically killed us) and there were also 28 days where Tramp had the day off.
Our big Ford F250, as much as we loved it, was a very thirsty beast. At 11.5 MPG (compared to 15.5 MPG from our Chevy Colorado in North America) we knew that Tramp’s drinking habits were going to be a problem. Which leads us to the costs…
The Costs (all costs in USD)
Average running costs per day (not including maintenance/shipping/flights) – $119.63
Breakdown of costs –
- Fuel – 37%
- Accommodation – 23%
- Food, drink, other small expenses – 40%
Average cost of gas per gallon – $3.96 ($1.04 per litre)
- Cheapest gas per gallon – $2.26 ($0.59 per litre) in El Triunfo, Ecuador
- Most expensive gas per gallon – $7.09 ($1.87 per litre) in Montevideo, Uruguay
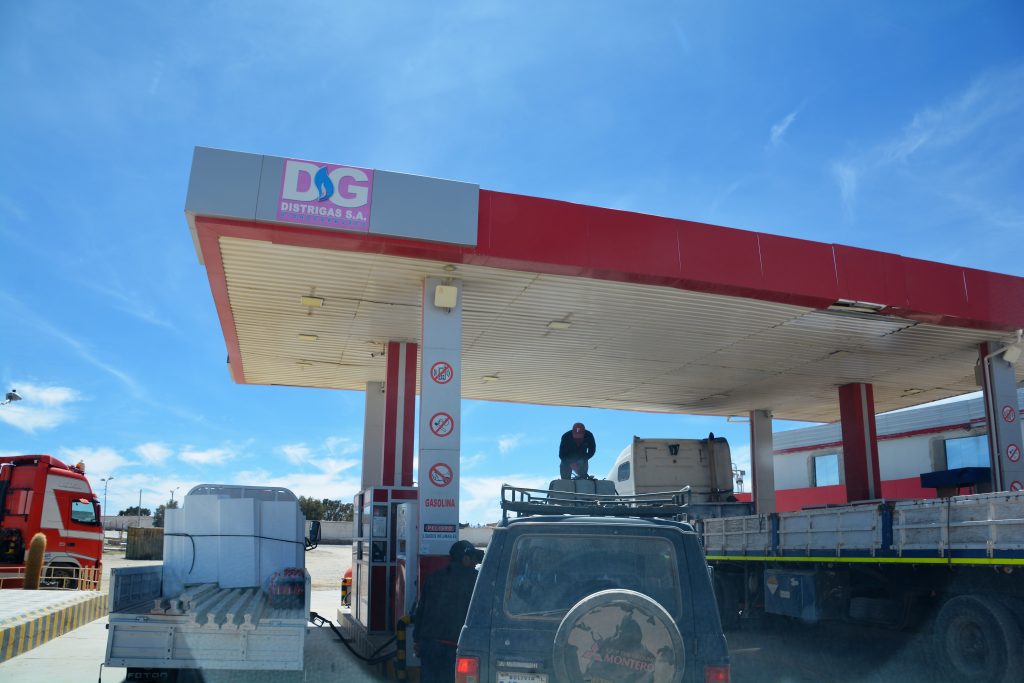
Fuel in Bolivia was crazy expensive and had a unique pricing system.
The government charges foreigners almost double for fuel so the local station owners charge you less and give you a dodgy receipt and pocket the rest. Only in Bolivia.
Julie and I are sensible about our food and drink but we don’t skimp on this either. Julie makes sure we maintain a very healthy diet and does a great job juggling our menus with what is available in the local shops and markets. No matter where we are and how limited the local supplies are she always manages to cook up something healthy and yummy. So this is a biggish cost for us. Some days we’ll also spend money on entrance fees, small souvenirs, road tolls (!) or other items such as a clothing item, toiletries, prepaid phone packages or ferries.
The biggest change in costs from our North American journey is the fuel costs. In the US and Canada the average cost per gallon was $2.94 whereas on this leg it is $3.96, a 34% increase in cost per gallon. On top of that, our Ford uses 25% more gas than our old Chevy which means our fuel costs have gone up from 28% of our total costs to 37% and our overall cost per day has gone up as well.
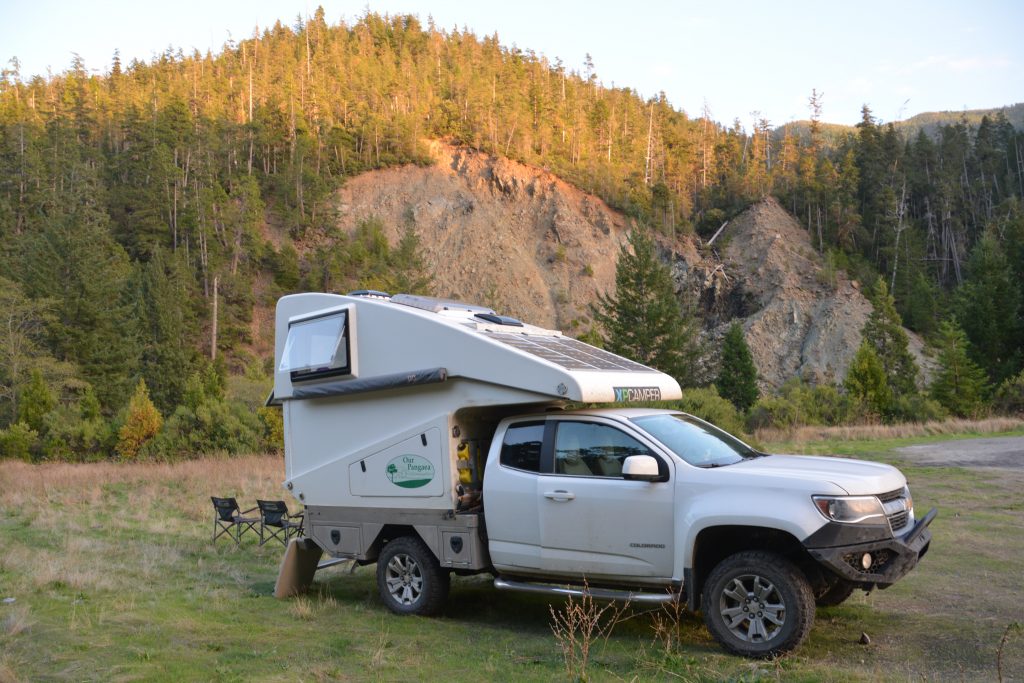
Remember this guy? This was our Chevrolet Colorado which we used on our North America leg of Follow the Sun. It was much more fuel efficient but too small to carry our big camper and we had to replace it with the much bigger but gas-guzzling Ford.
The Splurges and other big costs
We had three other categories for our costs, items that were not part of our day to day running costs. This included maintenance on our truck/camper, shipping and other fees we have to pay, such as visas and insurance, and our splurges. Shipping is a large cost because we have to put Tramp on a container ship to move between continents. Our two big splurges were flying to Cuba for six days and our six day cruise and flights in the Galapagos.
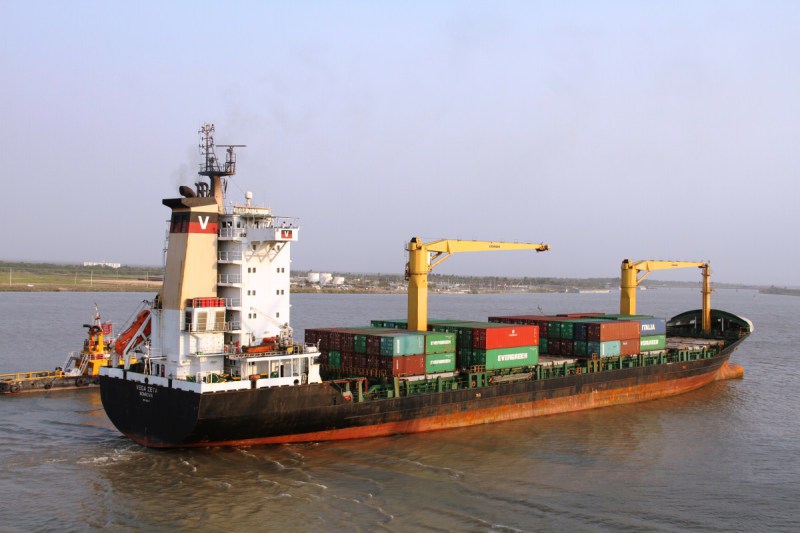
Shipping Tramp between continents is stressful and expensive – this is the Vega Zeta which carried Tramp from Panama to Colombia
If you add all these costs up for the Mexico, Central and South America leg it comes to over $12,000 which is pretty painful when you put it that way but the two optional items – Cuba and Galapagos – were huge highlights of our trip and we never would have wanted to miss those places.
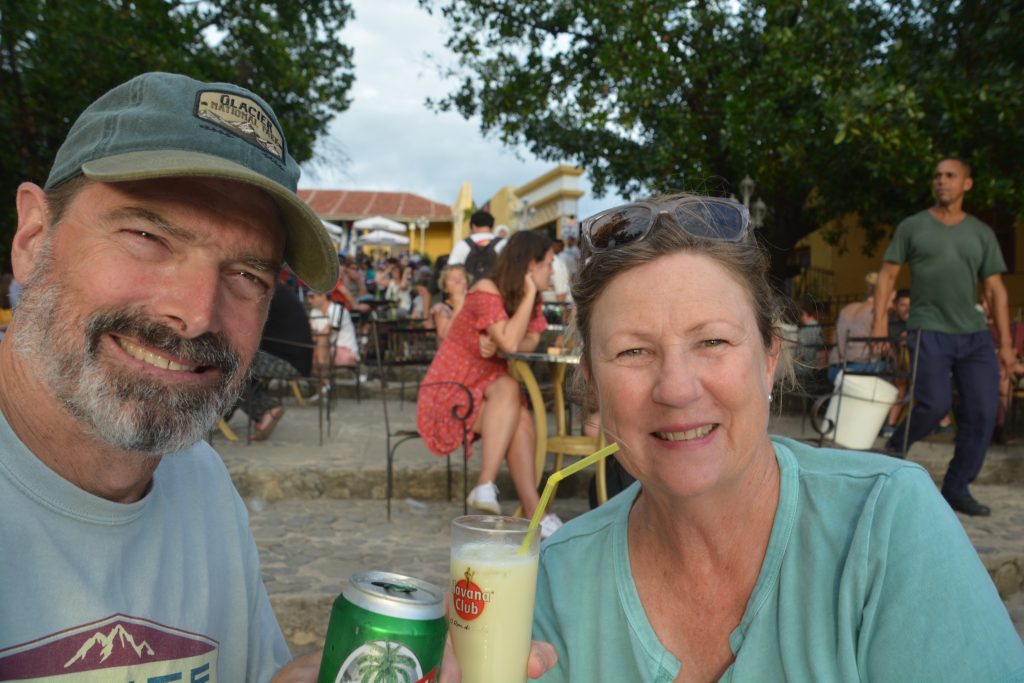
Enjoying an afternoon drink in a courtyard in central Trinidad on the south coast of Cuba – a fantastic splurge
Other fascinating statistics
I also kept track of the type of accommodation we had every night and the final count looked something like this:
- Free camp – 37% – any situation where we didn’t pay for our camping spot
- Paid camp – 38% – any situation where we had to pay, even if a couple of dollars in a truck stop
- RV camp – 1% – only happened twice in American-centric Baja
- Hard top accommodation – 24% – disproportionally high because of Cuba, Galapagos and our long stay in Cartagena waiting for Tramp to get off the container ship
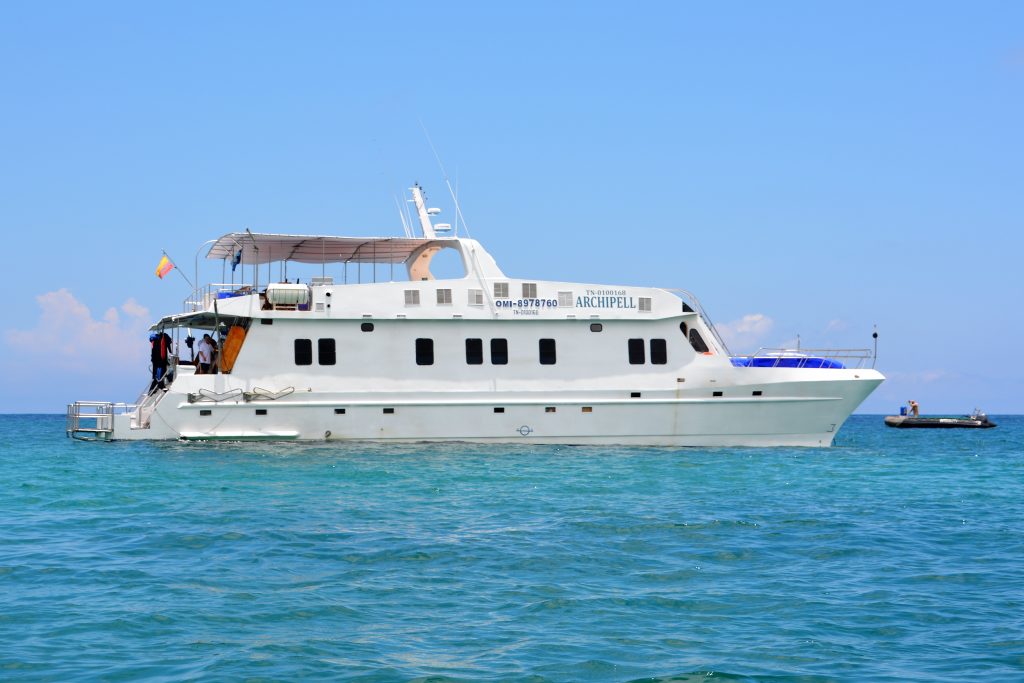
Not all hard top accommodation is the same – the Archipell II in the Galapagos provided luxury accommodation for five days
In Mexico and Central America we stayed mostly at truck stops, restaurants or hotels where we had to pay for our spot but these places gave us the all-important safety and security levels we wanted. In South America we free camped a lot more because we felt safer (and in some cases there was no choice!).
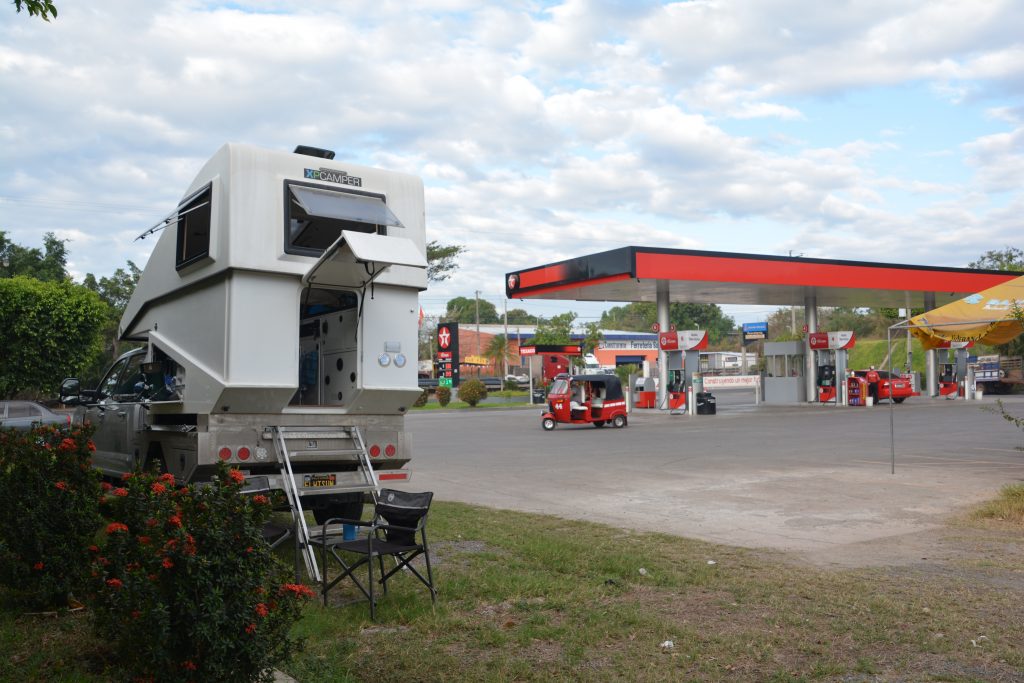
Our first night in El Salvador was at a Texaco station – we were a bit nervous about this one but it turned out great and they even had showers!
We rate every overnight spot on a scale of between one and ten depending on a range of subjective criteria such as scenery, uniqueness, safety, did we have a fire, was it on a lake or river, etc. We tried to keep the weather out of the calculation but sometimes a cold, wet and windy night did drag down the score. Because, after all, it’s totally subjective.
So based on this scientific calculation we stayed in four perfect ten spots in Central America – including possibly our best campsite ever in Costa Rica – but only two in South America. Curiously, and for the first time in spreadsheet history, these two sites were on consecutive nights – first out on the salt flats of Salar de Uyuni and the following night on the unforgettable Laguna Kachi high in the Bolivian Andes.
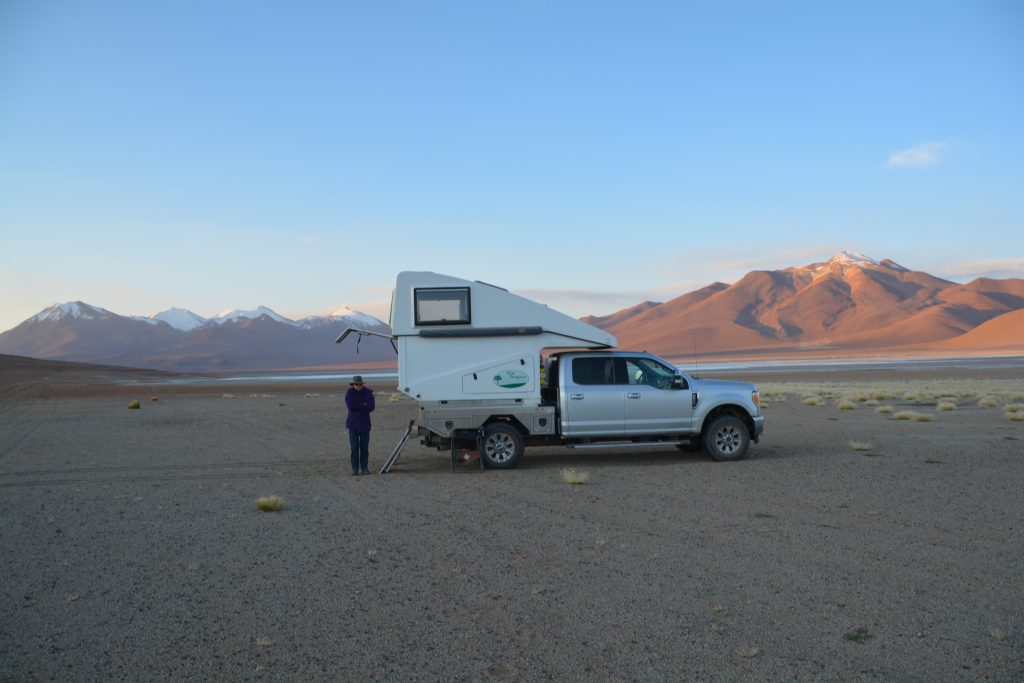
And the very next night we camped at Laguna Kachi at an astounding 4,500 metres in sub-zero temperatures – and it was unquestionably a perfect 10 camping spot
And as a final snippet of spreadsheet trivia, we had a fire on 27% of the nights, cooked outside on 66% of the nights and ate inside on 44% of the nights. Because you wanted to know.


Comments
By the numbers — No Comments
HTML tags allowed in your comment: <a href="" title=""> <abbr title=""> <acronym title=""> <b> <blockquote cite=""> <cite> <code> <del datetime=""> <em> <i> <q cite=""> <s> <strike> <strong>